WatchMyDC® Works as a Plugin for Your Network Monitoring Tool
WatchMyDC® works with your deployed network monitoring tool. They are also known as network management solutions (NMS). WatchMyDC® acts as an automation add-on for your NMS.
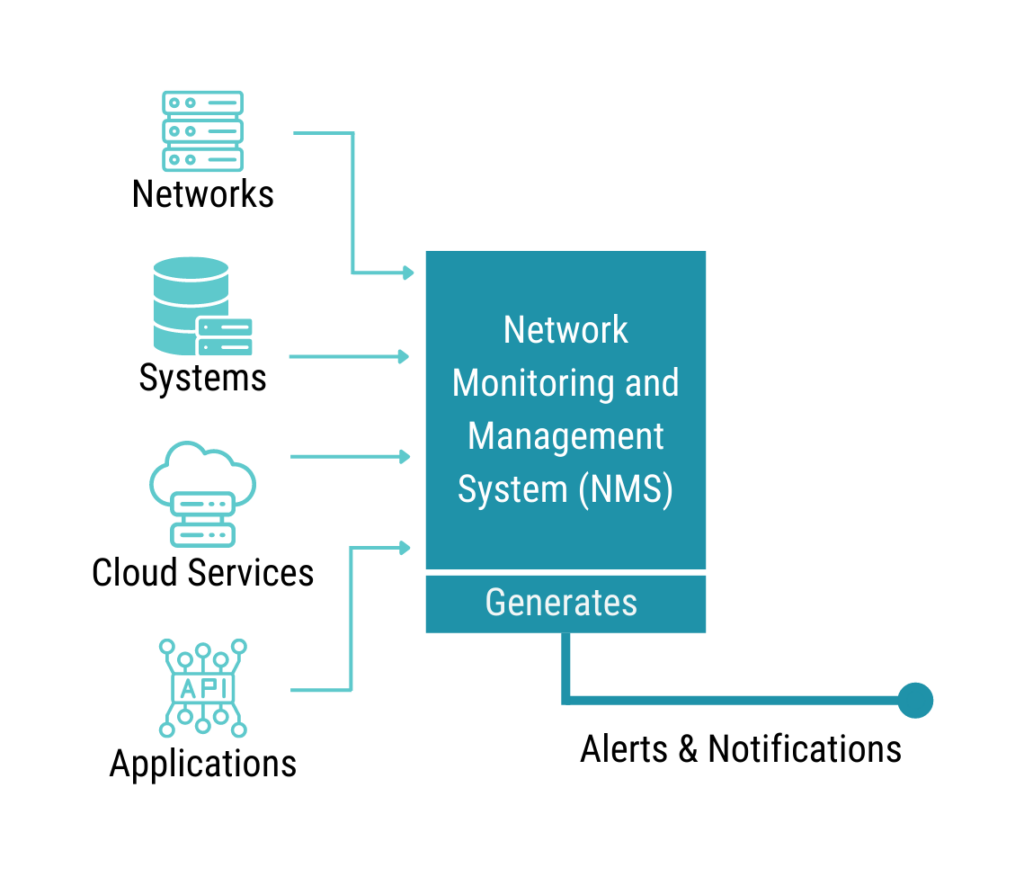
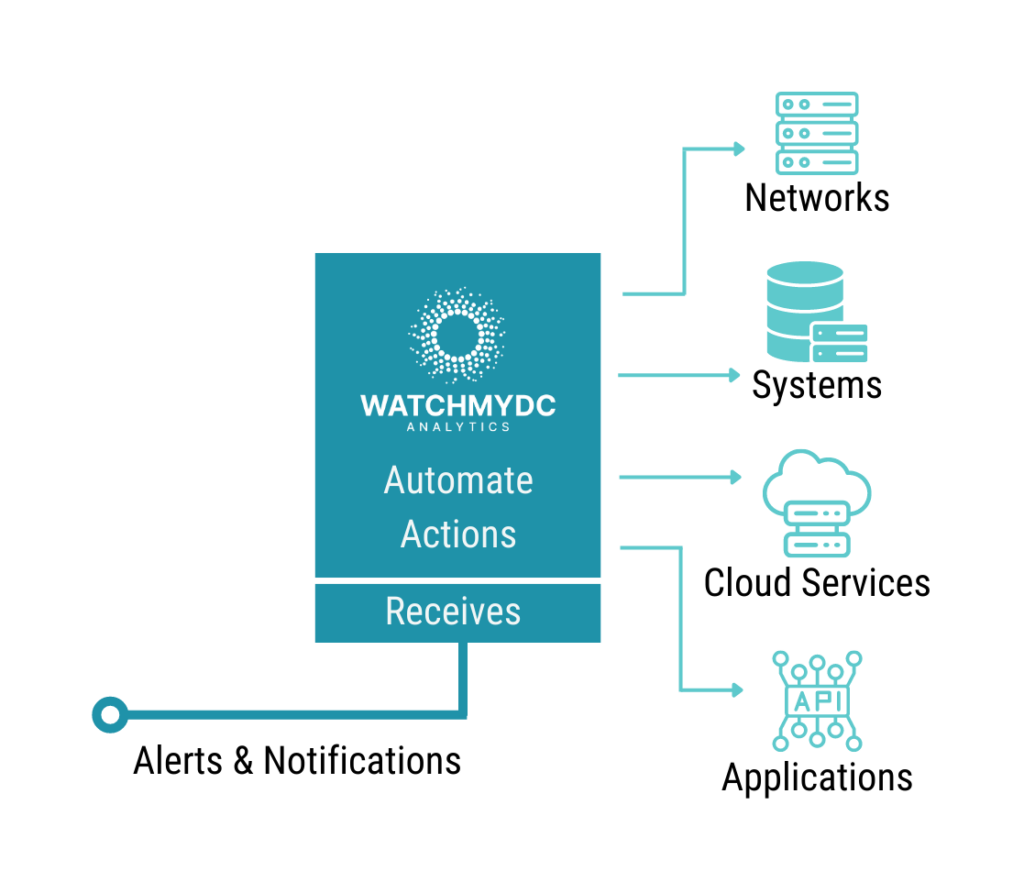
When your NMS is busy with health and performance monitoring of your hybrid infrastructure, WatchMyDC® steps in as a savior to resolve business critical issues automatically. Real-time notifications from your NMS are received by WatchMyDC®, which then processes and takes appropriate action.
More testing of market-leading network monitoring tool integrations is in progress. Any NMS with external Webhook or Syslog notification methods is interoperable with WatchMyDC®. Tested integration documents are regularly published in the WatchMyDC® Knowledge Base. Contact us if you want to integrate your NMS with WatchMyDC®.
Works with Any Network Monitoring Tool
Industry-standard network monitoring tool and management solutions (NMS) support external notification methods through various channels. WatchMyDC® receives notifications through open standard protocols such as Webhook and Syslog.
For example, ManageEngine OpManager external Webhook integration method can be found in their documentation here. The Zabbix Webhook integration method has been explained in this document. WatchMyDC® has also explained a few Webhook integration methods in their knowledge base.
Syslog is an alternate method to send alerts and notifications to WatchMyDC®. Syslog can be chosen as the preferred method if your NMS does not support Webhook notifications, such as Paessler PRTG.
With On-Premise NMS
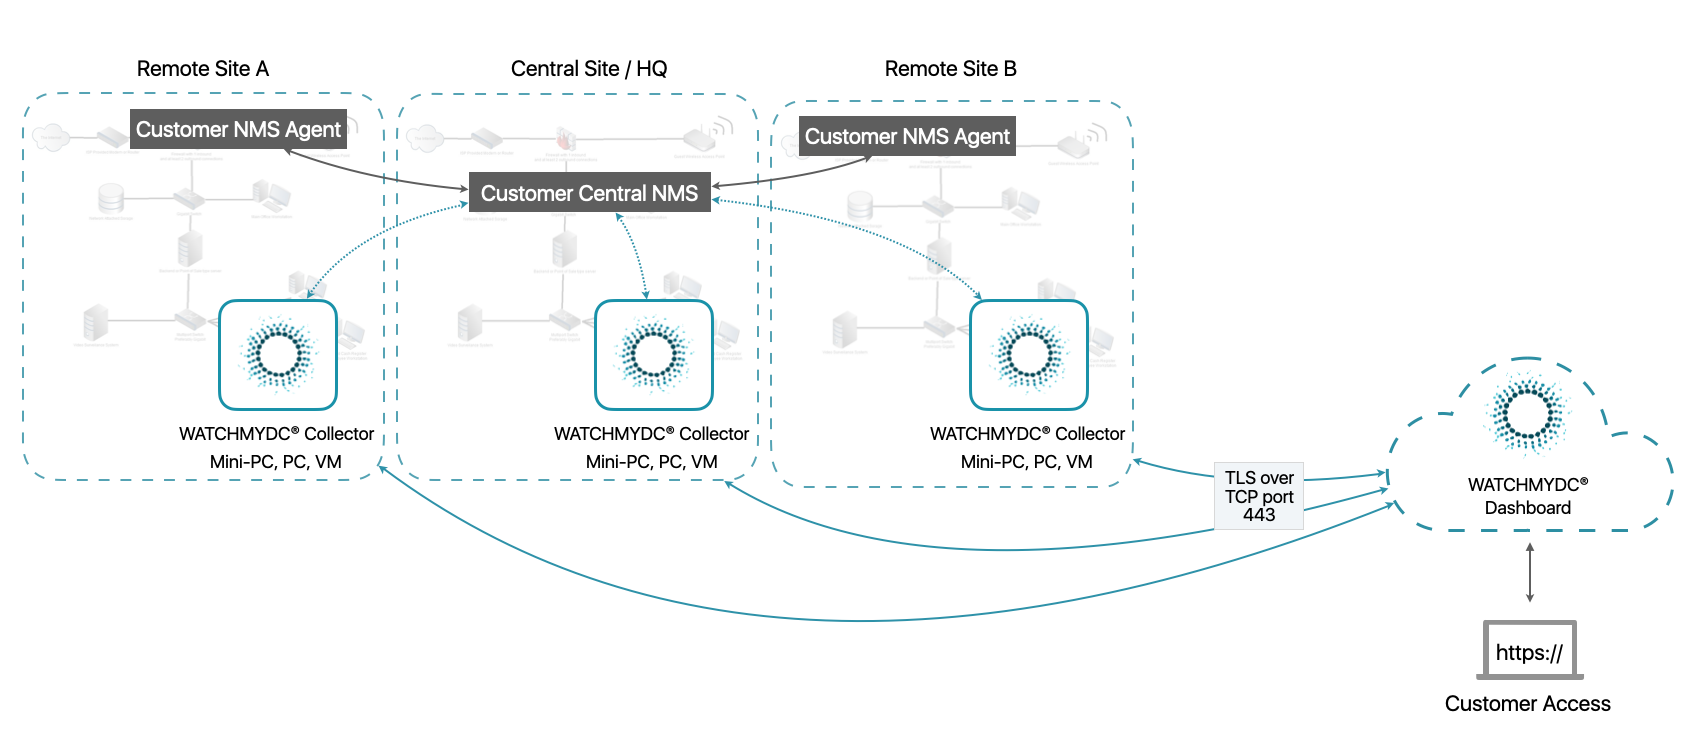
Your on-premise NMS can send incident and alert notifications to the WatchMyDC® Collector. WatchMyDC® Collector is a purpose-built Linux virtual machine (VM) that sits in your private network while communicating with the WatchMyDC® cloud services.
In a multisite environment, your centralized NMS can send notifications to site-specific WatchMyDC® Collector.
The detail of the WatchMyDC® solution architecture and various deployment models in a customer environment has been explained in the WatchMyDC® Design Document.
With Cloud-Based NMS
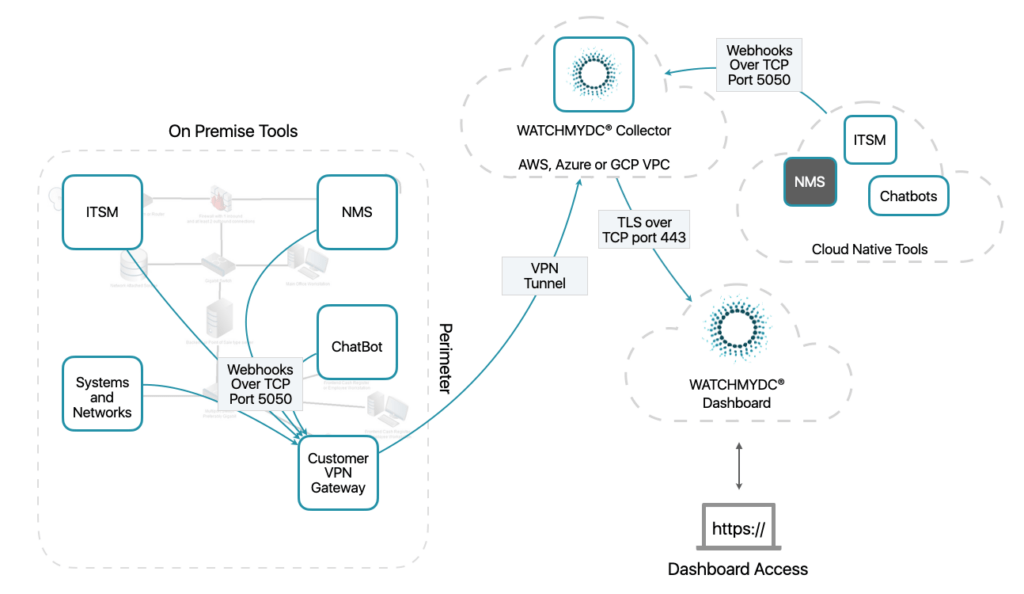
Cloud-based network monitoring and management solutions (NMS) such as LogicMonitor and DataDog can push the alerts notifications to the WatchMyDC® Collector deployed in any cloud environment such as Amazon Web Services (AWS) EC2, Microsoft Azure Virtual Machine, DigitalOcean, Google Cloud, etc. Customers can also send the Webhook notifications to a WatchMyDC® Collector deployed in a private network through port-forwarding in the perimeter firewall.
An Apache application process running in Ubuntu Server is monitored by Zabbix in this demo. The Zabbix notifies WatchMyDC® as soon as the Apache service is observed inactive (dead). WatchMyDC® re-instate the process within a minute.
Find more demo videos from WatchMyDC® official channel in Youtube.